|
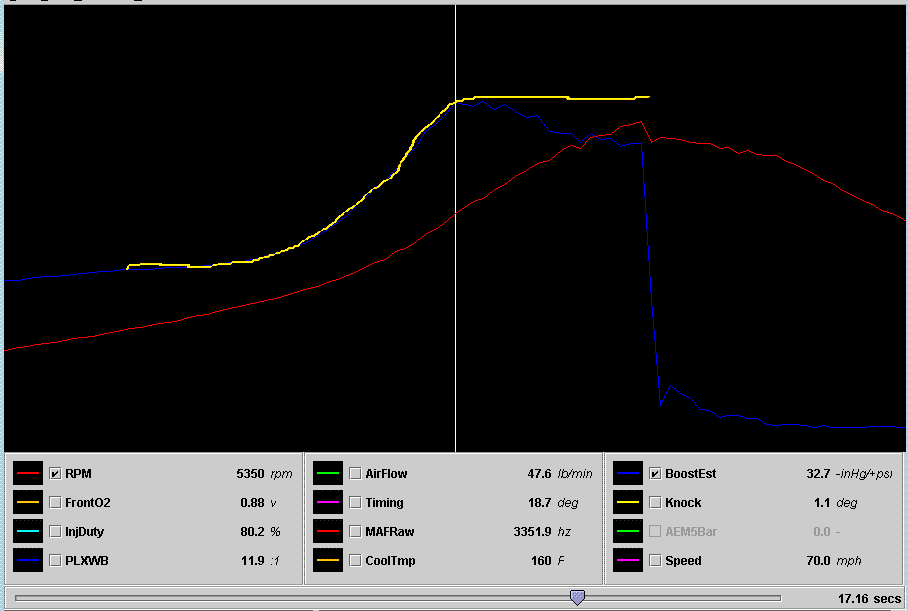
Below is one of my GT35R logs from a few years back. At that time I did not own a MAP sensor, so there is nothing that logged
actual boost. I instead hand drew in a Yellow line signifying what actual boost was in the log, just as if there was an AEM5Bar
installed.
Notice how BoostEst (Blue line) and Actual Boost (Yellow line) climb up as boost builds until 5300 RPM where it peaks.
Boost stabilizes all the way to redline, but BoostEst begins to drop rapidly as we get closer to redline. This is due to the
drop in VE as we travel further into the RPM range.
This is the ideal BoostEst Curve. The curve rises, then peaks in the 5000-6000 RPM range, and then rapidly falls as we
get further into redline.

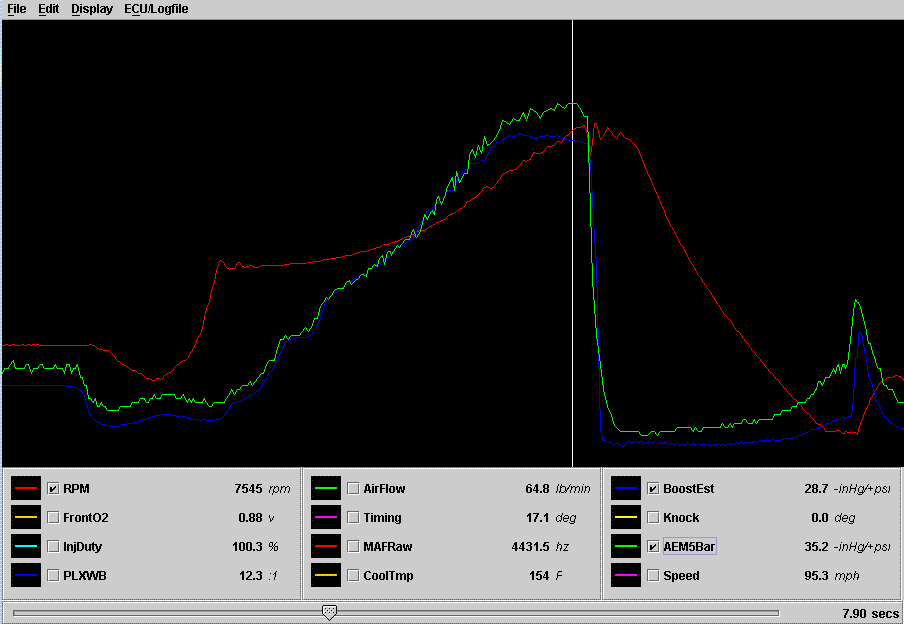
Below is another one of my logs. This one is an example of a well calibrated BoostEst Curve with a larger sized turbo that
does not spool up nearly as fast. There are times where you may have a turbo that has not even completely spooled up in the
100% VE range (5000-6000 RPM). The BoostEst Curve may look a little different.
This time the AEM5Bar is datalogged and you can see Actual Boost Vs. BoostEst. The AEM5Bar (Green) overlaps the BoostEst
Curve (Blue) as the turbo is spooling. Notice in this example that the turbo doesn't really reach full boost until around
6200 RPM. This is the reason why BoostEst is still climbing past the VE = 100%, 5000-6000 RPM range. Also note how BoostEst
and the AEM5Bar still manage to diverge from each other once past 6000 RPM since VE is dropping.

|

