|
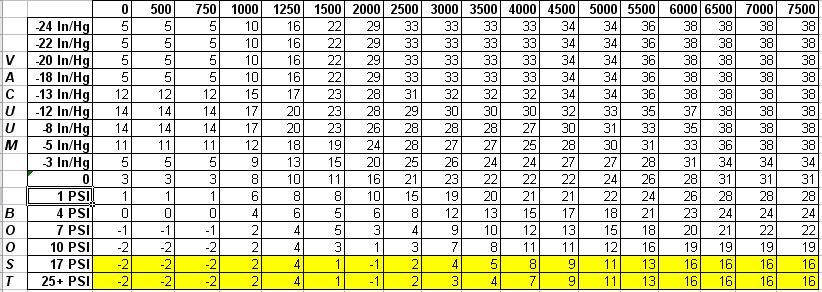
Notice the area highlighted in yellow. This is where DSMlink uses the "Show 2G Estimate" values from. Those numbers
on the bottom of the timing table are only valid when boost is GREATER THAN 17 PSI. Depending on what type of turbo you have
installed, you may physically be able to achieve 17 PSI at 3000 RPM or maybe 5000 RPM. So you can only use those "Estimates"
when your motor is injesting more than 17 PSI.
Now what about when you are below 17 PSI? This is where you just need to follow the table and see what value the ECU is
going to plug in. For example, you are just cruising around on the street...
Boost = 1 PSI
RPM = 3500 RM
Look it up on the table, and you will see that the ECU will give you 20 degrees of advance. BUT when you look at the "Show
2G Estimate" at 3500 RPM, you will see the value of just 5 degrees if that slider was zeroed out, not 20. But, if you
were above 17 PSI at 3500 RPM, then you would have had just 5 degrees of timing.
Now can you see a problem if you had raised the 3500 RPM timing slider until you saw the "Show 2G Estimate"
value to around 15 degrees? The 3500 Slider would now have to be at +10. Now the next timing you are just puttering around
town, and you are at 1 PSI at 3500 RPM, you will get a timing value of 30 degrees instead of 20. The chances of knock are
much higher now.
Now here is a 1G example. The 1G Timing Table is below. Once again, I modified it a bit to make it easier to read and
explain.
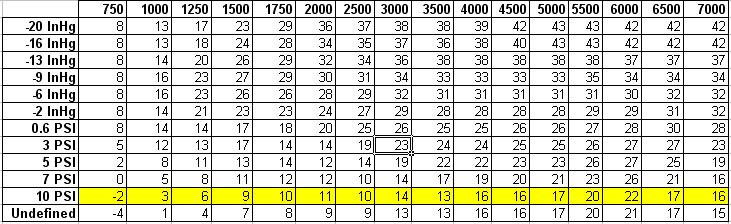
The 1G timing curve is
MUCH more aggressive than the 2G table. This is the main reason why 1G owners use the timing sliders to prevent knock, while
2G owners use the timing sliders to make power.
Look at the timing curve
assuming you were at full throttle and full boost (Undefined). It starts around a healthy 16 degrees at 4000 RPM and goes
up from there. By the time you are passing 5500 RPM, the ECU plugs in an aggressive 20 degrees. The peak is at 6000 RPM, where
you get 22 degrees which is insane on 91 pump octane. Then for some odd reason, the timing table drops rapidly down to 17
degrees at 6500 and then again 16 degrees at 7000 RPM.
Once again, you will also
need to pay attention to the part throttle timing curve. For example, you are again just puttering around town…
Boost = 3 PSI
RPM = 3500 RPM
Now when you look up the
1G table you will see 23 degrees. This is already a decently high value, and tuning this slider downward may be necessary.
So you definitely cannot just add more to the lower RPM timing slider until you see your target timing value in the “Show 1G Estimate”
What you really need to
do is just log a full 3rd gear log, from 2000 RPM to redline, in order to see the actual timing. Then make adjustment
from there to achieve your target timing curve.
|